With the integration of technology, influence diagrams have become even more effective, offering enhanced clarity and precision in decision-making processes. This article explores how technology enhances influence diagrams and how this combination can lead to more informed decisions.
Understanding Influence Diagrams
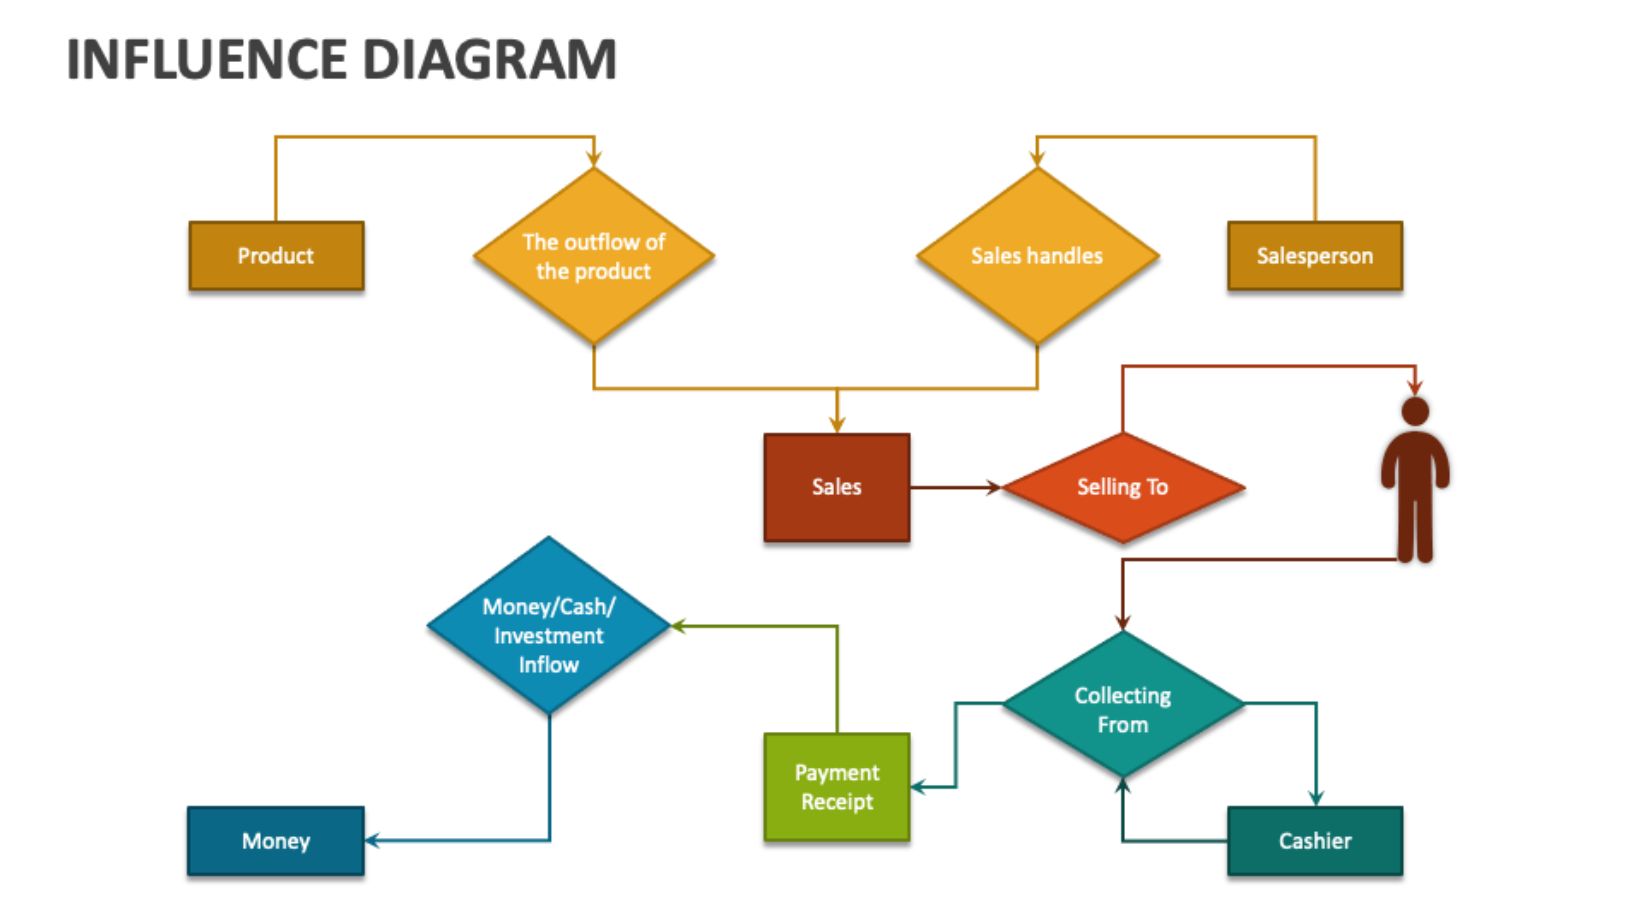
An influence diagram is a graphical representation used to illustrate the relationships between decisions, uncertainties, and objectives. Unlike traditional decision trees, influence diagrams focus on the dependencies between variables, making it easier to understand the impact of each decision on the overall outcome.
Key components of an influence diagram include decision nodes, chance nodes, and value nodes. Decision nodes represent choices, chance nodes illustrate uncertainties, and value nodes indicate outcomes or objectives. By connecting these nodes, influence diagrams provide a clear visual structure, helping decision-makers analyze complex problems.
The Role of Technology in Enhancing Influence Diagrams
Technology plays a crucial role in advancing the capabilities of influence diagrams. Software tools and platforms have made it easier to create, modify, and analyze these diagrams, making them more accessible and user-friendly.
Automated Diagram Creation
Modern software tools allow users to create influence diagrams automatically, reducing the time and effort required to manually draw connections between nodes. These tools often come with pre-built templates and drag-and-drop functionalities, enabling users to quickly build diagrams that accurately represent their decision-making processes.
Data Integration
One of the significant advantages of technology is the ability to integrate real-time data into influence diagrams.
This integration allows decision-makers to update their diagrams with the latest information, ensuring that their decisions are based on the most current data. For example, in business, integrating financial data into an influence diagram can help executives assess the impact of different strategies on profitability.
Advanced Analytics
Technology enables the application of advanced analytics to influence diagrams, providing deeper insights into decision-making processes. By using algorithms and statistical models, decision-makers can simulate different scenarios and predict outcomes with greater accuracy. This capability is particularly valuable in fields like finance and healthcare, where decisions often involve high stakes and uncertainty.
Collaboration and Sharing
With cloud-based platforms, influence diagrams can be easily shared and collaborated on by multiple stakeholders. This collaborative approach allows teams to work together in real-time, ensuring that all perspectives are considered in the decision-making process. Furthermore, these platforms often come with version control features, allowing users to track changes and revisit previous versions of their diagrams.
Visualization and Communication
Influence diagrams are already a powerful visual tool, but technology takes this visualization to the next level.
Advanced software allows users to create dynamic and interactive diagrams, making it easier to communicate complex ideas to a broader audience. For example, decision-makers can use animations to demonstrate how different variables interact or use color-coding to highlight critical factors.
Applications of Technology-Enhanced Influence Diagrams
The integration of technology with influence diagrams has found applications in various industries. In healthcare, influence diagrams are used to model patient outcomes and treatment plans. By incorporating real-time patient data and predictive analytics, healthcare providers can make more informed decisions about treatment options.
In business, influence diagrams are used to assess the impact of different strategies on company performance. With technology, companies can integrate financial data, market trends, and competitive analysis into their diagrams, providing a comprehensive view of their decision-making processes.
By automating diagram creation, integrating real-time data, and enabling advanced analytics, technology enhances the effectiveness of influence diagrams. As a result, decision-makers can make more informed, accurate, and strategic decisions. As technology continues to evolve, the role of influence diagrams in decision-making will only grow, offering even greater potential for optimizing outcomes and driving success.